Expected Pass Completion (xPass): A Better Way to Measure Passing Performance
MACHINE LEARNING · FOOTBALL ANALYTICS
Performance analysis has become an increasingly important aspect of modern football. From evaluating team performance and identifying weaknesses in opposition teams to uncovering potential transfer targets, the ability to accurately assess performance is invaluable. Consequently, advanced metrics like expected goals (xG) and expected threat (xT) have become increasingly important tools for analysing player and team performance. However, for one of the most fundamental aspects of football, passing, a basic metric like passing accuracy remains one of the primary measures of performance.
Passing accuracy provides a generalised measure of how well a player completes passes, without accounting for the context in which they are attempted. A five-yard backwards pass is treated equally to a line-breaking 40-yard pass into the penalty area, despite the significant differences in their difficulty and potential value to the team. This means that passing accuracy alone offers a limited understanding of a player's passing ability, highlighting the need for a more insightful way to evaluate passing performance.
In a similar way to how xG changed the analysis of attacking performance, Expected Pass Completion (xPass or xP) offers an opportunity to improve how passing performance is evaluated. By considering various characteristics of an individual pass, it is possible to estimate the probability that it will be completed. This allows us to better understand the types of passes players attempt through their average xPass value, as well as how effectively they execute them through Passes Completed Above Expected (PAx).
In this project, Opta’s xPass framework was adapted to investigate how xPass can be used to provide a more comprehensive evaluation of player passing performance.
Data and Methodology
The data used in this project consisted of event data collected from WhoScored, covering the top five European leagues: the Premier League, La Liga, Serie A, the Bundesliga and Ligue 1. This included every match from the 2025/26 season, with the events filtered to include only successful and unsuccessful pass attempts. This resulted in a dataset of 1,689,005 passes.
For model development, this data was divided into training (80%) and testing (20%) subsets using Scikit-learn’s GroupShuffleSplit. This meant the models were trained on 1,348,272 passes across 1,401 matches and tested on 340,733 passes in the remaining 351 matches. Importantly, matches were grouped by their game ID, ensuring that all passes from an individual match were allocated exclusively to either the training or testing datasets. This prevented passes from the same match appearing in both subsets, providing a more robust evaluation of the model's ability to generalise to unseen matches. The same split was maintained across all model generations to ensure a consistent comparison.
Similar data was also collected for the 2026/27 season, up to the 9th of November 2026. The final model was then used to predict xPass values for these passes, providing the data for subsequent player analysis.
The features used to train the models followed Opta’s outline for their xPass model. Each generation considered a new set of features, building upon the last. This incremental approach allowed the impact of introducing additional contextual information to be evaluated, showing whether features beyond the geometric properties of a pass could improve predictive performance.
Generation 1 - Geometric Passing Information
- Pass start and end coordinates
- Pass length
- Pass angle (sine and cosine components)
Generation 2 - Context of the Pass
- Foot or head pass
- Whether the pass was a cross
- Open play or set piece
- Ground or aerial pass
Generation 3 - Context of the Possession
- Number of passes in the possession so far
- Ball-carrying distance before the pass
- Vertical ball progression speed across the previous three actions
- Whether the previous action was by a teammate or opponent
- Distance and angle of the previous pass
Within each generation, two different machine learning models, logistic regression and gradient boosting, were trained using the same data. Their performance was evaluated using four metrics: accuracy, ROC-AUC, log loss and Brier score. Calibration and feature importance were also examined to provide further insight into the models' predictive performance and the features influencing their predictions.
The gradient boosting model outperformed logistic regression across all four evaluation metrics, in each comparable generation. This is likely due to its ability to capture non-linear relationships between features, allowing it to identify more complex patterns in passing outcomes.
However, the Generation 3 introduced some challenges due to incomplete data. Since the additional possession-context features were derived from event data, it was not always possible to establish the vertical ball speed across the previous three actions, the ball-carrying distance before a pass, or the distance and angle of the previous pass. As logistic regression cannot handle missing values, both models in Generation 3 were trained using only the number of passes in the possession so far and whether the previous action was by a teammate or an opponent.
A further model, Generation 3B, was subsequently developed using the gradient boosting classifier's ability to handle missing values natively. This allowed all available features to be incorporated, resulting in the strongest-performing model, which was selected for all subsequent analysis.
Once the final model had predicted an xPass value for every pass in the dataset, each player's passes were aggregated across individual matches and entire seasons. From this, three metrics were defined to help evaluate player passing performance.
A player's average xPass is calculated by taking the mean predicted completion probability of all their attempted passes. This provides an indication of a player’s passing difficulty profile. A higher average xPass suggests that a player typically attempts easier passes, whereas a lower average xPass suggests they attempt more difficult passes.
Passes Completed Above Expected (PAx) measures how well a player executes passes relative to the model’s expectation. Successful and unsuccessful passes are assigned an outcome of 1 and 0 respectively. For an individual pass, PAx is defined as:
For example, a pass predicted with an xPass of 0.80 that is completed receives a PAx of 0.20, whereas an unsuccessful attempt receives -0.80. Consequently, successfully completing difficult passes generates a greater positive PAx, while failing to complete easier passes results in a greater negative PAx. Since PAx is cumulative, however, it is naturally influenced by the number of passes attempted, making comparisons between players with different passing volumes less meaningful.
Passes Completed Above Expected per 100 Passes (PAx per 100) normalises PAx for the number of passes attempted, allowing more meaningful comparisons between players with different passing volumes. It is defined as:
Multiplying the normalised values by 100 provides a more intuitive interpretation. For example, a player recording 4 PAx per 100 passes would, over 100 attempts, complete four more passes than the model expected on average. A positive value indicates a player who is outperforming the model’s expectations, while a negative value indicates a player who is underperforming them.
Model Evaluation
The final gradient boosting model, Generation 3B, achieved the strongest performance across all four evaluation metrics. Its results are shown in Table 1.
| Metric | Gradient Booster Gen 3B |
|---|---|
| Accuracy | 89.16% |
| ROC-AUC | 0.9302 |
| Log Loss | 0.2501 |
| Brier Score | 0.0772 |
Table 1: Performance metrics for the final model.
Accuracy measures the proportion of passes that the model correctly classifies as either successful or unsuccessful, using a probability threshold of 0.5 to distinguish between the two outcomes. A baseline model that predicted every pass as successful, achieved an accuracy of 81.34%, reflecting the proportion of successful passes in the dataset. The final model’s accuracy of 89.16% represents a considerable improvement. However, since the aim of this project is to estimate a probability of a pass being completed, accuracy alone is not sufficient to evaluate the model.
A good model should assign higher probabilities to successful passes and lower probabilities to unsuccessful passes. ROC-AUC measures how effectively the model distinguishes between these two outcomes. A score of 0.5 represents performance equivalent to random ranking, while a score closer to 1 indicates better discrimination. The final model’s score of 0.9302 suggests that, if one successful and one unsuccessful pass were selected at random, the model would assign the successful pass a higher xPass probability approximately 93.02% of the time.
Log loss evaluates how well the predicted probabilities align with the actual outcomes, heavily penalising confident but incorrect predictions. A score of zero indicates perfect predictions, with the model assigning a probability of 1 to successful passes and 0 to unsuccessful passes. The final model's score of 0.2501 indicates strong predictive performance.
Similar to log loss, the Brier score evaluates the accuracy of predicted probabilities by measuring the mean squared difference between predictions and actual outcomes. A score of zero indicates perfect predictions, with lower scores representing better performance. For comparison, assigning a probability of 0.5 to every pass would produce a Brier score of 0.25. The final model achieved a considerably lower score of 0.0772, further demonstrating its ability to produce reliable probability estimates.
Another important test is to evaluate how well the model’s predictions match reality, this is done through calibration. A well calibrated model provides more reliable predictions, which is important in our case since it will provide a more trustworthy view of player’s passing abilities.
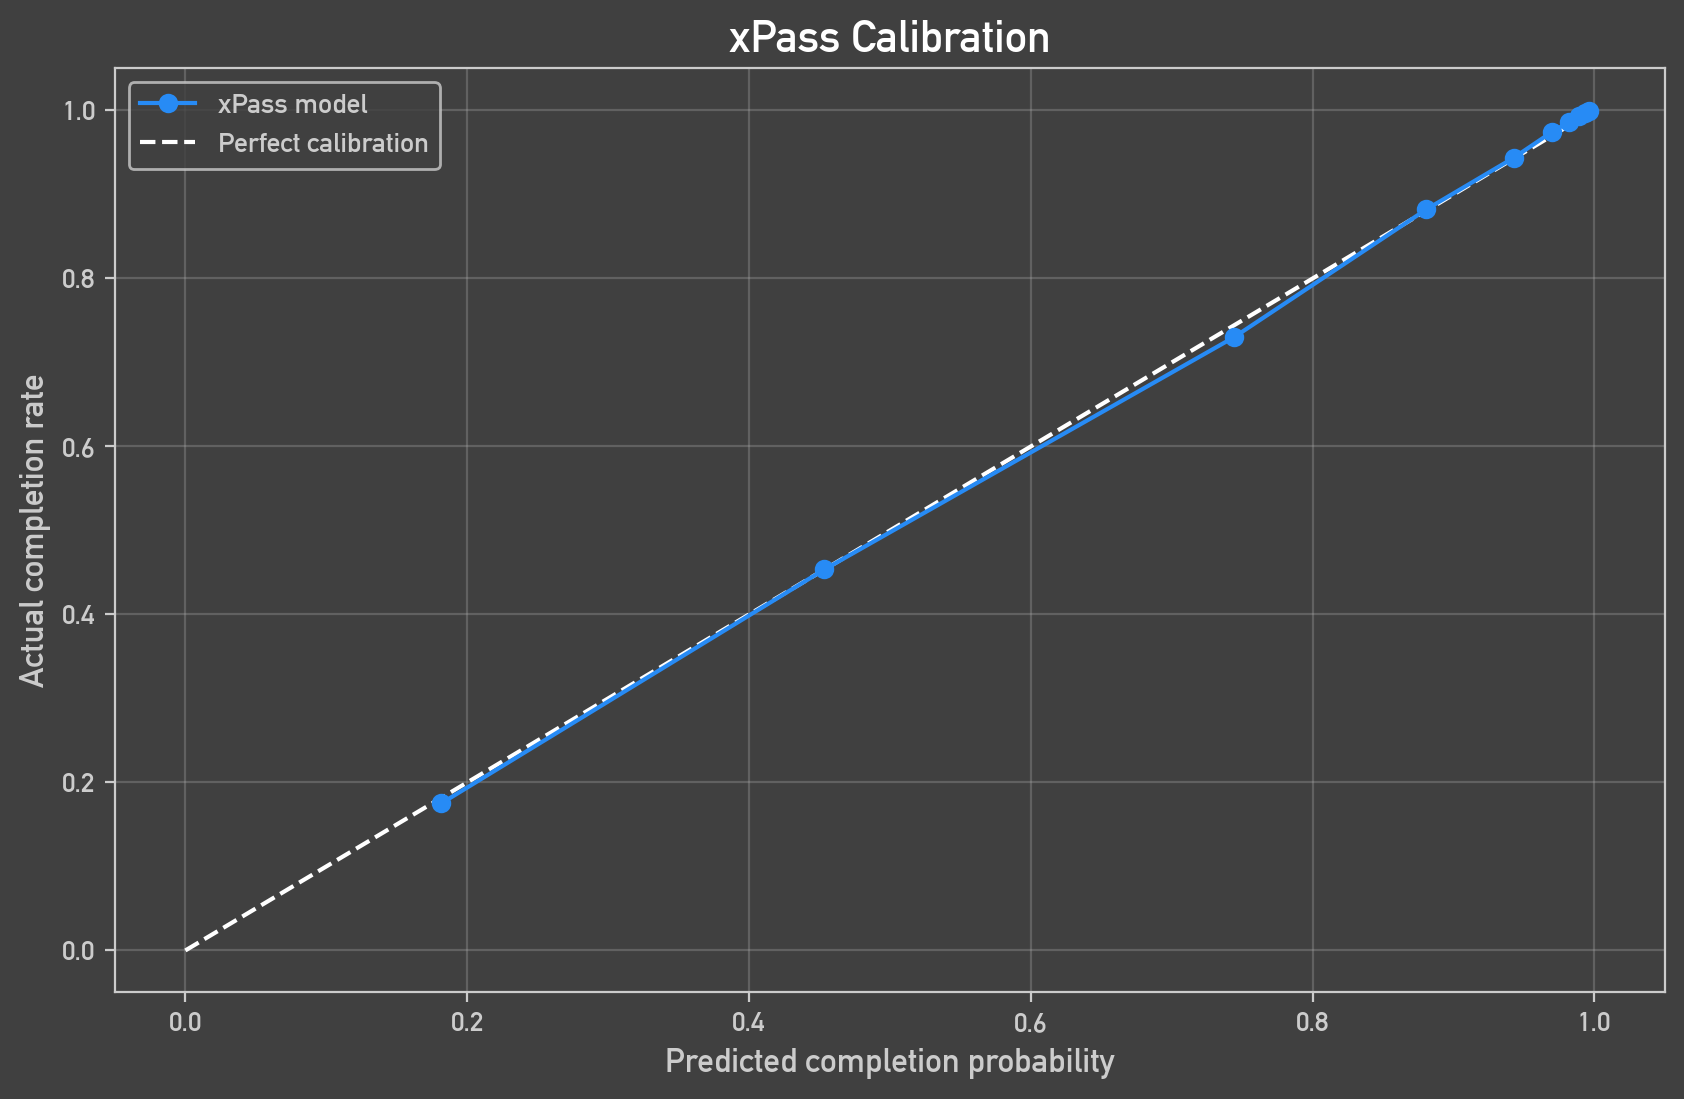
Figure 1: Calibration curve for the final model, comparing predicted pass completion probabilities with observed completion frequencies.
For a perfectly calibrated model, the predictions would lie along the diagonal, indicating that the observed completion rate matches the predicted probabilities. Points below the indicate overconfidence, where the model overestimates the probability of pass completion, while points above it indicate under confidence. As shown in Figure 1, the model appears to be well calibrated overall, with most points lying close the this line. The largest deviation occurs in the 0.618–0.831 probability bin, where the model overestimates the actual completion rate by 0.014, or 1.4 percentage points. Given the relatively small size of this discrepancy, the calibration plot suggests that the model produces reliable probability estimates overall.
Finally, SHAP (SHapley Additive exPlanations) was used to better understand the model's predictions. This method estimates how much each feature contributes to a model's prediction. Using a sample of 500 passes from the testing dataset, the analysis provides insight into which features have the greatest influence on the model's predictions and how different feature values affect them.
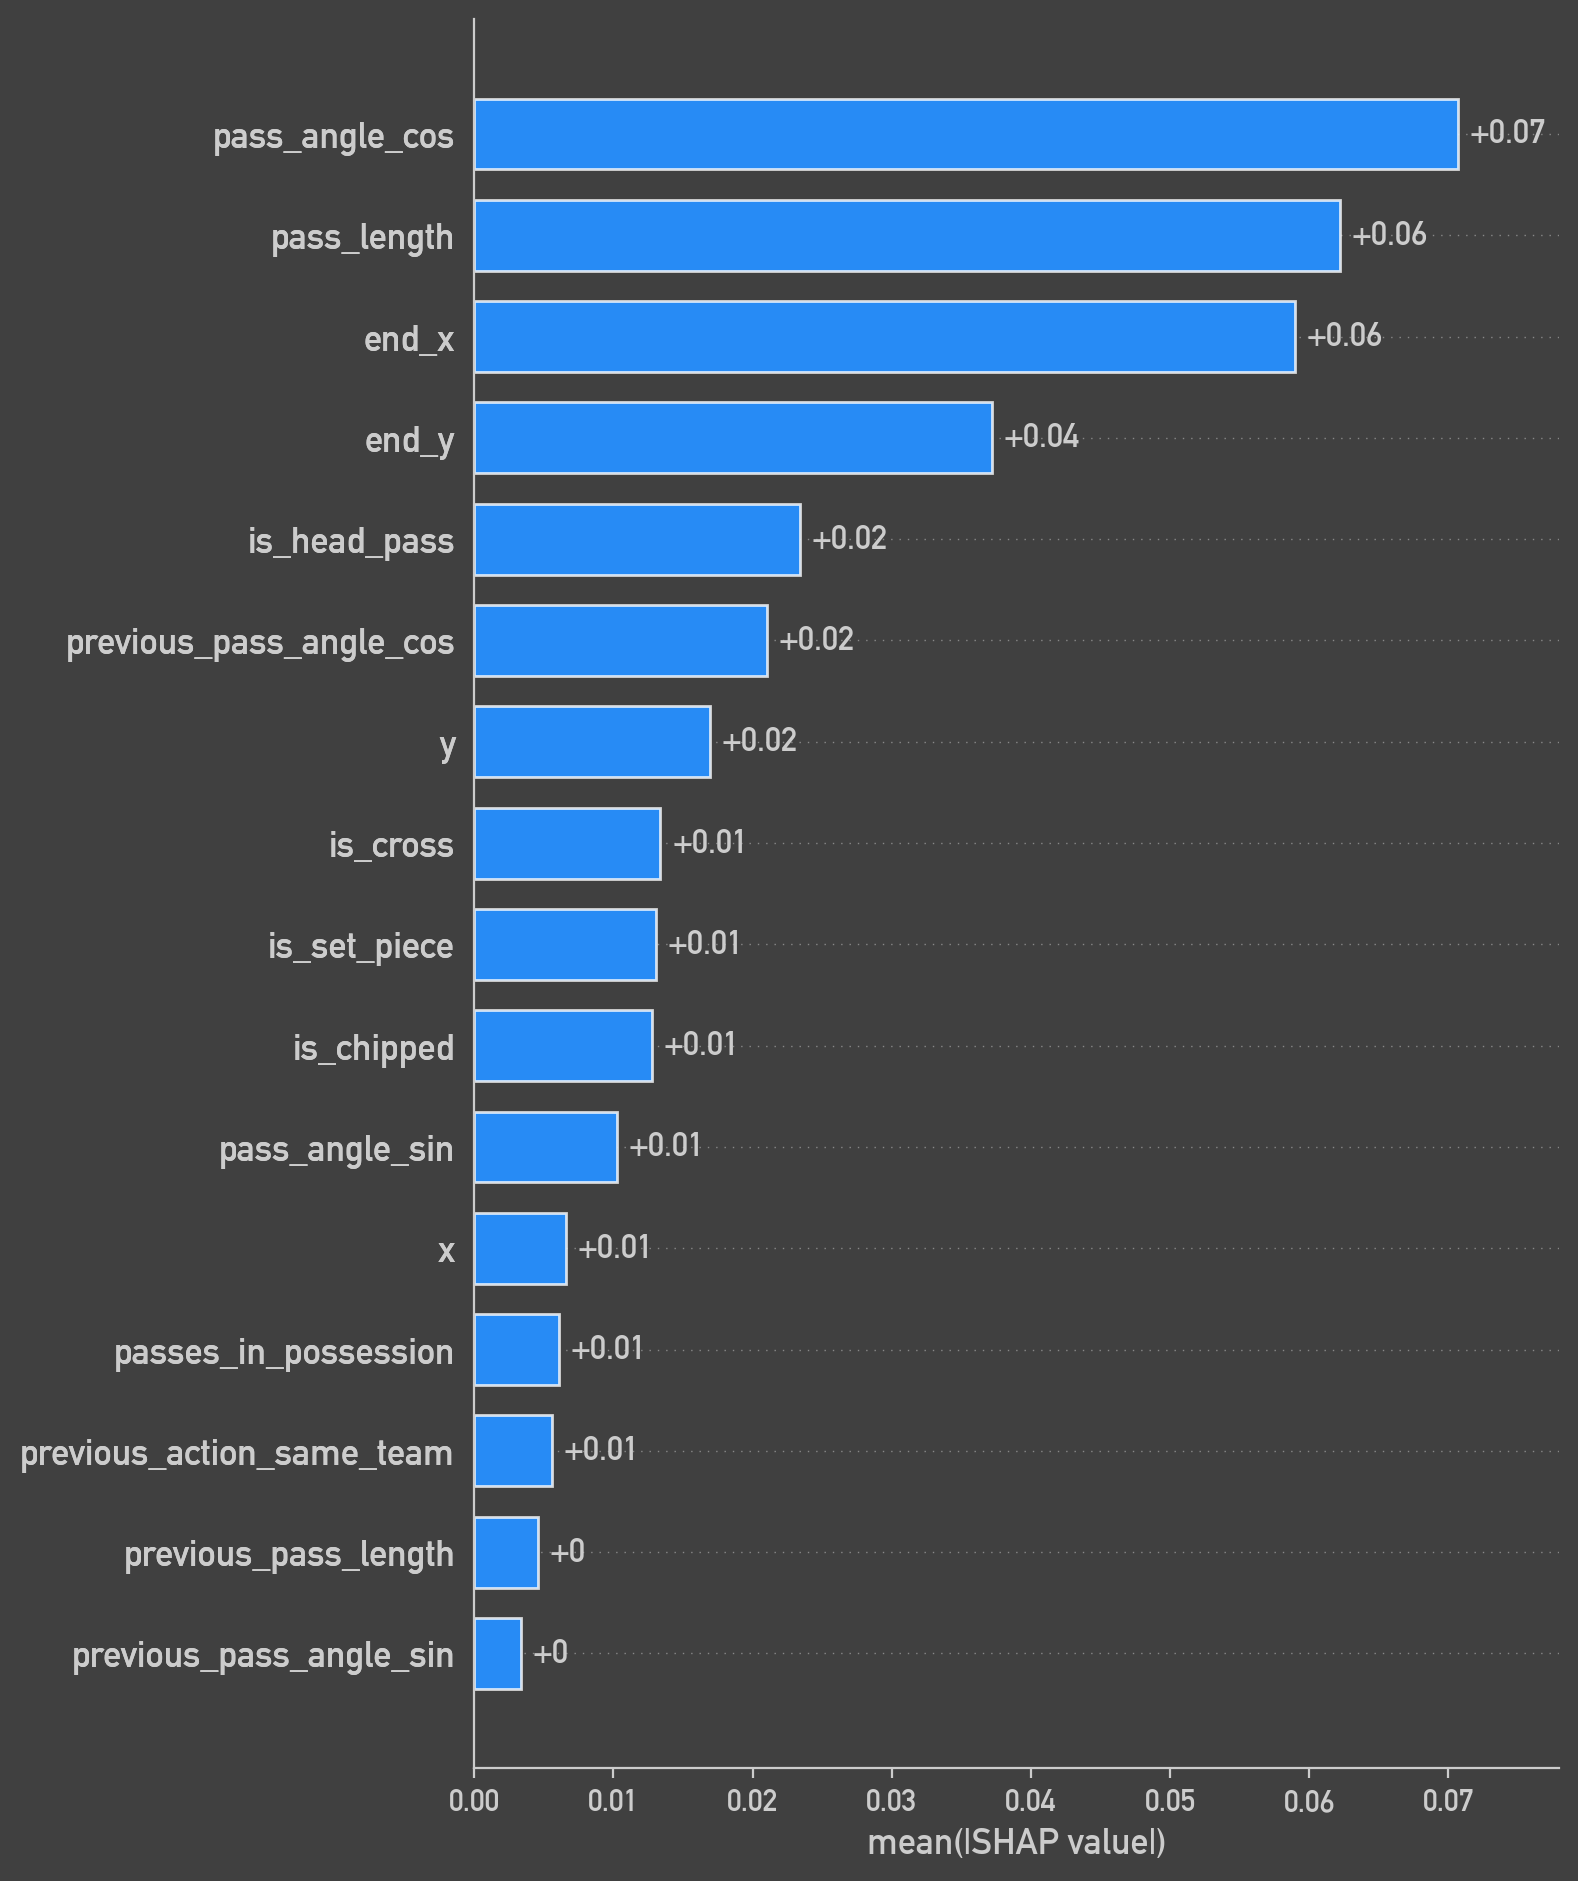
Figure 2: Mean absolute SHAP values showing the overall importance of each feature in the final model.
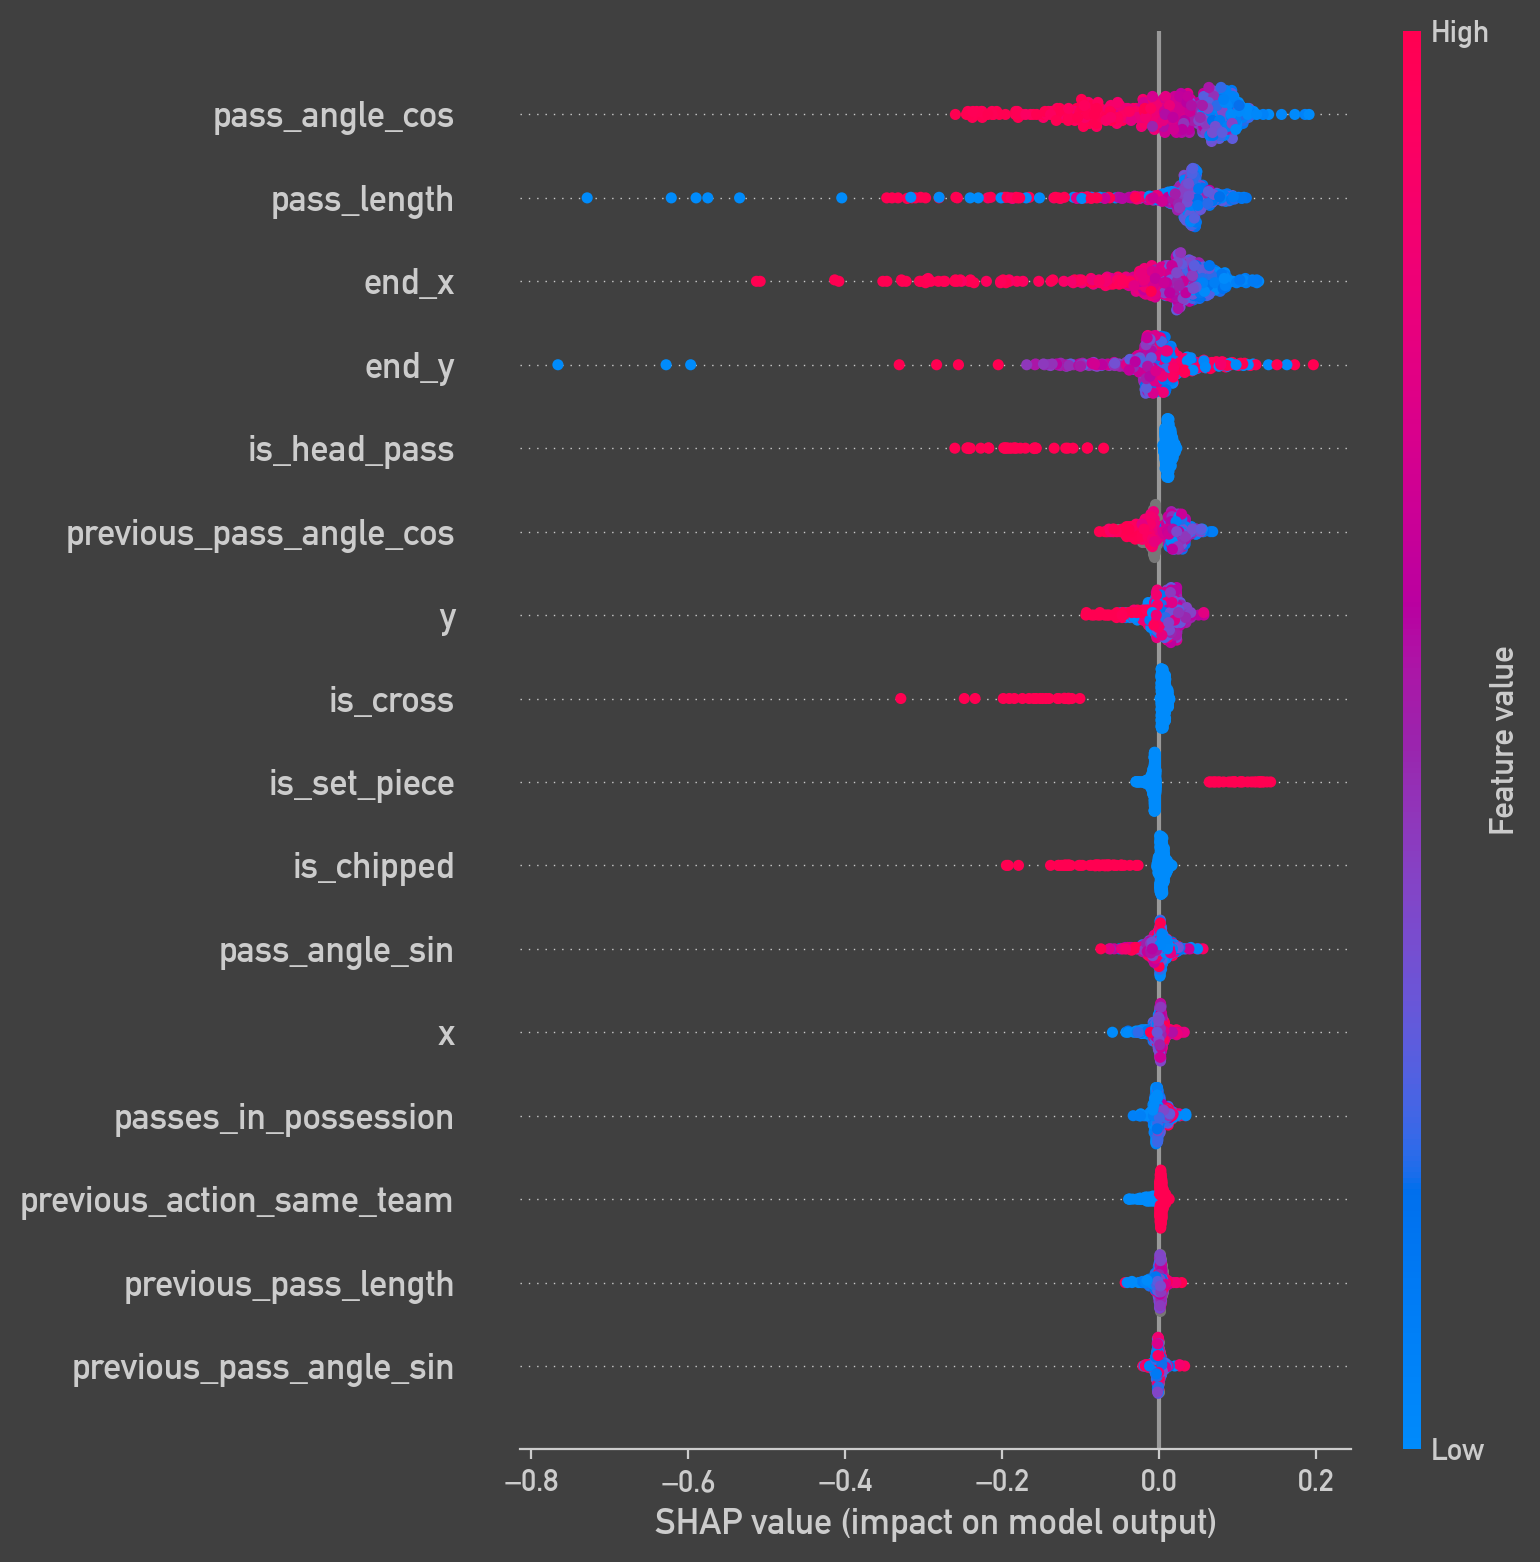
Figure 3: SHAP beeswarm plot illustrating the distribution and direction of each feature's influence on predicted pass completion.
Figure 2 shows the mean absolute SHAP value of each feature, indicating its average contribution to the model’s prediction. The cosine component of passing angle, pass length, and the end x-coordinate were the three most influential features. In contrast, the additional possession-context features introduced in Generation 3 had relatively little influence on the model's predictions.
The cosine component of the passing angle captures the forward or backward direction of a pass. A higher value indicates a pass directly forwards towards the opposition goal while a lower value indicates a pass directly backwards towards the team’s own goal. Figure 3 suggests that passes played forwards generally reduce the predicted probability of completion, while backwards passes tend to increase it. This aligns with footballing intuition, as forward passes are more likely to travel into areas occupied by opposition players.
A similarly intuitive pattern can be seen for pass length and the end x-coordinate. The model has learned that longer passes generally have a lower probability of completion. Furthermore, passes ending closer to the opposition goal also tend to receive lower xPass values. This is understandable, as these areas are often more heavily defended, making passes into them more difficult to complete.
Overall, the final model demonstrated strong predictive performance, with good discrimination and calibration. Its predictions were also largely influenced by features that align with established footballing principles, providing confidence in its application to player passing analysis.
Results
One of the motivations for creating an xPass model was due to the limitations of other metrics used to evaluate passing. In this section we will evaluate how xPass can be used in conjunction with existing metrics to provide better context about passing ability.
Figure 4: The relationship between average xPass and passing accuracy for players with at least 20 appearences in Europe's top five leagues during the 2025/26 season (r = 0.958, R² = 0.918, p < 0.001, n = 1,502).
Figure 4 highlights the limitations of passing accuracy as a standalone measure of passing performance. Although a high passing accuracy is often associated with better passing ability, it does not account for the difficulty of the passes attempted. The very strong correlation between average xPass and passing accuracy (r = 0.958), calculated across all players with more than 20 appearances in the 2025/26 season, supports this. Players with higher passing accuracy generally attempt easier passes, while those with lower passing accuracy tend to attempt more difficult ones. This demonstrates the exact issue that was outlined at the start of this project, that passing accuracy alone provides an incomplete picture of a player's passing performance.
Figure 5: The relationship between average xPass and PAx per 100 passes for players with at least 20 appearences in Europe's top five leagues during the 2025/26 season (r = 0.412, R² = 0.170, p < 0.001, n = 1,502).
Figure 5 demonstrates a moderate positive correlation (r = 0.412) between average xPass and PAx per 100 passes for all players with a minimum of 20 appearances in the 2025/26 season. This suggests that players who attempt easier passes tend to outperform the model’s expected completion rate by a greater margin than those who attempt more difficult passes.
However, the relatively low R^2 value of 0.170 indicates that average xPass only explains 17% of the variation in PAx per 100 passes. This is of course because PAx is closely related to passing accuracy but suggests that a player's passing difficulty profile alone explains relatively little of their performance relative to the model's expectations.
Figure 6: The relationship between average xPass and xT per 100 passes for midfielders with at least 20 appearences in Europe's top five leagues during the 2025/26 season (r = -0.539, R² = 0.291, p < 0.001, n = 412).
Figure 6 establishes another interesting relationship between average xPass and xT per 100 passes. The moderate negative correlation (r = -0.539) suggests that players who attempt more difficult passes tend to generate greater expected threat from passing. The R² value indicates that average xPass accounts for 29.1% of the variation in xT per 100 passes. This provides evidence of an association between passing difficulty and attacking threat, suggesting that players who attempt more challenging passes can contribute more to their team's attacking progression.
Overall, these findings demonstrate how xPass can complement existing passing metrics to provide a more comprehensive evaluation of player performance. Passing accuracy alone offers limited insight into the difficulty of passes attempted, while average xPass provides additional context by evaluating the types of passes players are attempting. Furthermore, the relationship between average xPass and xT suggests that players attempting more difficult passes tend to generate greater attacking threat. Rather than replacing existing metrics, xPass can therefore be used alongside them to provide a better understanding of both a player's passing profile and their execution.
Applying xPass to Analyse Player Performance
Having established that xPass and PAx provide informative measures of passing performance, the next step is to explore how these metrics can be applied to player analysis. Their value lies in the ability to examine passing performance from several different perspectives. By tracking players across seasons, comparing their execution across different passing difficulties and visualising their individual passing patterns, it becomes possible to build a more comprehensive understanding of both their passing tendencies and execution.
Tracking Changes in Performance
While tracking passing accuracy across multiple seasons can indicate how a player's passing performance has changed, tracking average xPass and PAx can provide additional context as to why these changes may have occurred.
Figure 7: A plot showing the changes in average xPass and PAx per 100 passes between the 2025/26 and 2026/27 season for players with a minimum of 400 and 100 passes in the respective seasons.
Figure 7 tracks changes in players' average xPass and PAx per 100 passes between the 2025/26 season and the ongoing 2026/27 season. Considering these two metrics together allows changes in passing execution to be examined alongside changes in the difficulty of passes attempted.
For example, Noni Madueke has seen a substantial increase in PAx per 100 passes, rising from -3.81 to 4.22. However, his average xPass has also increased from 0.710 to 0.781, suggesting that he has been attempting easier passes on average. This provides some context for his improved PAx, although it cannot entirely explain the change. His improved performances this season may also be reflected in his ability to execute passes more effectively than the model expects.
Conversely, Ronald Araujo's PAx per 100 passes has fallen from 2.76 to 0.88, alongside a decrease in average xPass from 0.884 to 0.723. While he is now attempting more difficult passes on average, this does not necessarily explain the decline in his execution. Having moved from Barcelona to Liverpool over the summer, he is adapting to new teammates, a different tactical system and a new league. He has also been deployed at right-back, a position in which he may be less comfortable.
These examples demonstrate how changes in passing difficulty can provide additional context when evaluating changes in passing execution. However, average xPass alone cannot explain these changes, with factors such as player roles, tactical systems and opposition also influencing passing performance.
Comparing Passing Profiles
Another application of xPass is its ability to identify the types of passes players attempt and how effectively they execute them. This is demonstrated in Figure X, which divides players' passes across a season into different difficulty categories based on their predicted xPass values. This allows their passing profiles to be examined in greater detail, identifying the types of passes they are most effective at completing.
Figure 8: Passing profiles of Declan Rice and Elliot Anderson since the beginning of the 2025/26 season. Passes are divided into three difficulty categories based on their predicted xPass values: Easy (xPass > 0.85), Moderate (0.60 < xPass ≤ 0.85) and Difficult (xPass ≤ 0.60).
Figure 8 compares the passing profiles of Elliot Anderson and Declan Rice across the selected period. While their overall passing profiles appear broadly similar, dividing their passes into different difficulty categories reveals some important differences.
For easier passes, the two players demonstrate similar execution. However, Anderson performs considerably better on moderate passes, recording a PAx per 100 of 4.28 compared to Rice's -0.72. Rice, on the other hand, attempts a greater proportion of difficult passes (19.17% compared to Anderson's 17.49%) and executes them more effectively, recording a PAx per 100 of 0.42 compared to Anderson's -2.03.
This demonstrates how xPass can provide a more detailed understanding of individual passing profiles, revealing differences that may be obscured by overall passing statistics. Such comparisons could be useful in squad building and transfer recruitment. For example, a team looking to recruit a progressive midfielder could identify players who attempt a high proportion of difficult passes while maintaining positive PAx. Similarly, these comparisons could help identify potential replacements for players approaching the end of their contracts, providing a starting point for more detailed scouting.
Analysing Individual Performances
Finally, xPass can be used to examine passing performance on an individual-match basis. By visualising a player's passes on a passing map and colouring them according to their predicted completion probabilities, it becomes possible to identify the areas of the pitch in which they attempt easier or more difficult passes. This can help highlight individual passing patterns, identify particularly challenging attempts and provide insight into how a player approaches different areas of the pitch.
Figure 9: Jan Paul van Hecke's passing map from Tottenham's 1-0 loss to Leeds United on November 7th 2026. Passes are coloured according to their predicted xPass values, with outcomes indicated by the end point.
While a passing map cannot provide a complete explanation of a player's performance, it can highlight patterns that warrant further investigation. Game state, player roles and tactical instructions all influence the types of passes attempted, and these factors cannot be fully captured by xPass alone. However, if used alongside video analysis, passing maps could help analysts identify particular situations and investigate the decisions behind individual passes.
Discussion
The initial motivation behind this project was to address the limitations of existing metrics used to analyse passing performance in football, particularly passing accuracy. A high passing accuracy does not necessarily indicate a good passer, as it can also reflect a player who predominantly attempts safe passes. The very strong correlation between average xPass and passing accuracy (r = 0.958) supports this, highlighting the relationship between the difficulty of passes attempted and a player's overall completion rate. Furthermore, the moderate positive correlation between average xPass and PAx per 100 passes (r = 0.412) suggests that players attempting easier passes tend to execute them more successfully, although pass difficulty alone explains relatively little of the variation in passing execution. The moderate negative relationship between average xPass and xT per 100 passes (r = -0.539) also highlights an association between attempting more difficult passes and generating greater attacking threat. Taken together, these findings demonstrate how xPass can be used alongside existing metrics to provide a more detailed understanding of player passing profiles, considering both the difficulty of passes attempted and how effectively they are executed.
The potential applications of xPass within football are wide-ranging, although I believe one of its strongest applications could be player recruitment. As demonstrated in Figure 8, breaking down a player's passing into different difficulty categories provides greater insight into their individual strengths and weaknesses. This additional detail could help clubs identify transfer targets who possess particular passing qualities, as well as assess how they might complement existing players within the squad. Beyond recruitment, tracking changes in average xPass and PAx over time can provide context for changes in passing performance, while individual passing maps can help identify patterns and areas of interest for further match analysis.
Overall, the purpose of this project was to explore how xPass could provide a more informative way of evaluating passing performance beyond traditional metrics, and I believe the results demonstrate its potential to do so. However, xPass should not be viewed as a replacement for existing measures such as passing accuracy or expected threat. Instead, when used together, these metrics provide different perspectives on passing performance, offering a more comprehensive understanding of a player's passing tendencies, execution and attacking contribution. Further development of the model and the incorporation of more detailed contextual information could help expand these applications and improve the quality of its predictions.
Model Limitations
Although the xPass model demonstrates strong predictive performance across the evaluation metrics, several limitations should be considered when interpreting its predictions and applying it to player analysis.
The first limitation concerns the available data and how certain features were derived. Most features could be extracted directly from WhoScored event data. However, some of the contextual features introduced in the Generation 3 models required additional calculations. For example, ball-carrying distance was estimated by calculating the straight-line distance between the point at which a player received the ball and the point from which they played their pass. While this provides a useful approximation, it does not account for any deviations from this straight-line path, meaning the actual distance travelled by the player may be considerably different. Consequently, this approximation may limit the accuracy and usefulness of the feature within the model.
Similarly, vertical ball progression speed over the previous three actions, as well as previous pass angle and length, could not always be derived, particularly when there were insufficient previous actions within a possession. This resulted in missing values for several features across a proportion of the dataset. Although the gradient boosting model can handle missing values natively, the absence of these features means that the model cannot utilise this contextual information when generating predictions for those passes, potentially limiting its predictive performance.
Another limitation is that the model does not explicitly account for the individual characteristics of the player attempting the pass. Instead, it estimates the probability of an average player completing a pass based on its available characteristics. This means that differences in individual technical ability are not considered, despite their potential influence on the outcome of a pass. For example, a technically gifted player may be more capable of executing difficult passes than another player attempting an identical pass. Consequently, PAx should be interpreted as a measure of execution relative to the model's expectations, rather than an absolute measure of a player's technical passing ability.
Furthermore, the model was trained exclusively on data from the five major European leagues during the 2025/26 season. Therefore, its predictions may not generalise as effectively to other leagues or seasons, where differences in playing styles, tactical approaches and player quality could influence passing patterns. Although the test set consisted of matches unseen during training, these matches were still drawn from the same season and competitions. Further testing across different seasons and leagues would be necessary to establish how well the model generalises to unfamiliar data.
Perhaps the most significant limitation is the model's inability to account for the positioning and movements of opposition players. Without access to tracking data, the model cannot determine whether passing lanes are blocked, how much pressure is being applied to the passer, or how closely the intended receiver is being marked. These factors can have a considerable influence on the difficulty of a pass, even when its starting and ending coordinates are identical.
The most immediate way to improve the model would be to incorporate a wider range of data from additional leagues and seasons, helping to improve its generalisability. However, the most significant improvement would be the incorporation of tracking data, allowing the model to account for the influence of opposition pressure and positioning on the probability of pass completion. This would provide a much more comprehensive understanding of the context in which passes are attempted and potentially improve the model's predictive performance.
Conclusion
Overall, this project has demonstrated the limitations of existing methods for evaluating player passing performance and explored how xPass can provide additional context. Whether through comparing player passing profiles across different difficulty levels or tracking changes in passing trends over time, xPass offers a more detailed understanding of the types of passes players attempt and how effectively they execute them. While the model developed has several limitations, the objective of this project was not necessarily to create a perfect model, but rather to demonstrate the potential value of xPass as a tool for analysing passing performance.
In the modern analytical landscape of football, relying solely on metrics such as passing accuracy provides an increasingly limited view of player performance. xPass offers an opportunity to complement these traditional measures, providing greater insight into an aspect of football that has often received less attention than other areas of performance analysis. Ultimately, I believe that metrics such as xPass have significant potential to become more widely adopted, helping clubs, analysts and supporters develop a deeper understanding of player passing performance.
Technical Stack
| Area | Tools |
|---|---|
| Programming Language | Python |
| Data Collection | BeautifulSoup, Playwright |
| Data Processing | Pandas, NumPy |
| Machine Learning | Scikit-learn |
| Statistical Analysis | SciPy |
| Model Evaluation | SHAP, Scikit-learn |
| Data Visualisation | Matplotlib, Plotly |
| Model Persistence | Joblib |
| Development Environment | Jupyter Notebook, VS Code |
| Version Control | GitHub |