Premier League Usage Rates
DATA ANALYSIS · FOOTBALL ANALYTICS
The idea behind this project was born from a friendly debate between a good friend and myself about Bruno Fernandes.
My friend hold Bruno in very high regards, labelling him as Manchester United's best signing of the pos-Ferguson era and one of the best midfielders in Premier League History. While I don't disagree that Bruno is an excellent footballer, I believe that there is an argument that his highly dominant role in Manchester United's attaack can sometimes limit the impact of the players around him.
Bruno is often the focal point of Manchester United's attack, looking to drag his team through games by attempting difficult passes to create chances and taking plenty of shots on himself. But is his output actually worth the amount of the ball he uses?
We can look at Bruno's direct output, goals, assists and other attacking metrics and compare these numbers with his teammates or Manchester United's overall output. However, there is no metric to quantify how much of his team's attacking play is chanelled through him and wether the output he produces is proportionate to the amount of possession he consumes.
The answer to our debate seemed to lie in a different sport entierly.
Basketball fans will be well acquainted with the term usage rate, a statistic designed to measure a player's ball dominance by estimating the proportion of their team's possessions that end with them. It is common for a team's star player to have a high usage rate, as the team's tactical system is often designed to give them a large share of shooting opportunities.
In this project, I explored whether the concept of the basketball usage rate can be translated into football, and what its potential uses could be in the context of football analytics.
Adapting Usage Rates to Football
The first step of this project was to formulate a method for adapting basketball usage rate to the context of football. In basketball, usage rate is an estimate based on a player's field-goal attempts, free-throw attempts and turnovers during the time they spend on the court. The standard formula is:
An important aspect of this calculation is that it accounts for the amount of time a player spends on the court. Therefore it estimates the proportion of their team's possessions that a player uses while they are on the court, rather than simply measuring their share of possessions over the course of an entire season.
While this project was inspired by this metric, I adapted the methodology for football and simplified the calculation, given the available data.
The first consideration was identifying the actions in a football match that can result in a player ending their team's possession. These include an inaccurate pass, an unsuccessful take-on, being dispossessed by an opponent, a shot, or simply miscontrolling the ball. By counting these across the entire season, I defined a player's Possession Ending Actions (PEA) as:
Critically, my PEA metric does not include miscontrols. This was down to a lack of large scale data across the whole of the season, meaning I had to omit them from the formula. This in turn means that my PEA metric is incomplete and should be treated as an estimation of a player's total possession losses rather than a definitive figure.
Having defined the PEA for each player, I then calculated their Usage Rate as the proportion of their team's total PEA that they were responsible for across the whole seaoson:
This is a more simplified measure than the basketball equivalent, as it does not adjust Usage Rate for the amount of time a player spends on the pitch. Instead, it measures the proportion of a team's total PEA that a player accounts for over the course of the season. This provides a measure of a player's importance in their team's attacking structure, which can be compared with the attacking value they generate to identify effective and wasteful players.
Measuring Creativity
The usage rate I defined through PEA was a useful metric for explaining how much of the ball a player used, but it did not explain what they did with that possession. Furthermore, the metric was naturally biased towards attacking players, who are more frequently responsible for finishing possessions and therefore more likely to lose the ball while attempting to create scoring opportunities. I therefore required a metric to quantify a player’s attacking impact relative to their share of possession.
Goals and assists were the natural starting point, but both have limitations when measuring creative involvement. Goals are primarily an outcome of the attacking process rather than a direct measure of creation, while assists can be heavily influenced by the quality of the teammate finishing the chance. Chances created, defined as a pass which leads directly to a shot, provides a better measure of creative involvement as it removes some of the dependence on the quality of the eventual finish. However, it still only credits the player directly responsible for the final pass and does not account for other actions which can contribute to creating a shot, such as dribbling or winning possession high up the pitch.
I therefore chose Shot Creating Actions (SCA) as the metric for creativity. SCA credits the two offensive actions directly preceding a shot, allowing a wider range of attacking contributions to be recognised, including both the final action and secondary actions involved in creating the opportunity. This metric provides a more representative measure of a player's creative involvement.
However, since usage rate is a measure of proportion within a team, I had to define a new metric in order to compare a player's creative output fairly. This was defined as a player's Attacking Involvement, the proportion of their team's total SCA that they were responsible for across the season:
The purpose of the analysis then became to comapre players across teams and positions based on their usage rate and attacking involvement. This allowed me to identify efficient and wasteful creators across positions and to evaluate the impact of players within their own team's attacking structure.
Methodology
After Establishing the concepts of usage and creativity, the analysis was divided into two main sections:
- League-wide positional analysis - PEA / 90 mins was compared with SCA / 90 mins across different positional groups for players from all Premier League teams. This provided a league-wide view of how players used the ball and the creative output they generated.
- Team analysis - This analysis investigated player usage rates relative to their creative involvement within individual teams. This allowed different attacking roles and structures to be identified while accounting for the way possession was distributed across each team. Beyond this I explored the fit of summer 2026 transfers within their new teams and the impact of players who departed.
Data Collection
Premier League data for the 2025/26 season was collected using the soccerdata and ScraperFC Python packages, which provided access to data from SofaScore and WhoScored.
SofaScore provided player totals, team totals and player information. However, SCA was not included in the available player statistics and I was unable to find a freely available source providing complete SCA totals for the season. The soccerdata package did, however, provide access to the underlying event data for every Premier League match across the season. I therefore developed an algorithm to identify shots and trace the two preceding offensive actions in order to calculate each player's total SCA.
These SCA totals should be considered estimates rather than official league statistics from providers such as Opta. The same principle applies to PEA since I could not identify a free and sufficiently reliable source for miscontrols across the entire season. Miscontrols were therefore omitted from the final PEA calculation, meaning that the resulting PEA and usage-rate values are also estimates.
Relative Creative Efficiency
For the team analysis, I developed an additional metric, Relative Creative Efficiency (RCE), to quantify a player's creative output relative to their share of team usage.
RCE was designed to distinguish between players who generate a high level of creative output given their usage and players whose creative contribution is relatively low compared with the amount of possession-ending activity they account for. A value above 1 generally represents efficient creators while a value below 1 represents wasteful creators. However, context is important when interpreting RCE, since defenders and defensive midfielderes might have low RCE values because of their role within their team and not because they are inefficient creators.
Player Validity Thresholds
The original data contained statistics for 497 players who played at least one minute in the Premier League during the 2025/26 season. However, for the purpose of this analysis, it was not necessary to include every player. Players who played less than 900 minutes across the season were excluded from the positioanl analysis since their per 90 minute statistics were not representative of their overall contribution. This threshold was reduced to 450 minutes for the team analysis, since usage rate and creative involvement are relative measures and therefore less sensitive to small sample sizes. Goalkeepers were also exclueded from the analysis since they are not typically involved in attacking play and therefore have limited relevance to the analysis.
Positional Analysis
The first section of this analysis investigated how useful possession ending actions and shot creating actions are for identifying creative involvement across different positional groups. Since these metrics are designed to evaluate ball involvement and creativity, centre-backs were omitted from this section. Instead, the analysis focused on fullbacks, midfielders, strikers and wingers.
For each positional group, I plotted PEA / 90 against SCA / 90, with the size of each point representing the player's direct goal involvement over the season. A regression line was then fitted to each positional group to summarise the relationship between ball involvement and creative output, while the residuals were used to identify players whose SCA / 90 was substantially higher or lower than predicted by their PEA / 90.
Fullbacks
Fullbacks are not necessarily the primary targets for a metric designed to evaluate attacking involvement, since their roles can be heavily defensive. However, modern football contains a wide variety of fullback roles, with some players operating in aggressive attacking positions and acting as important creative outlets for their teams. I therefore included fullbacks to investigate how these different roles affect the relationship between ball involvement and creativity.
Of the 66 fullbacks included in the analysis, just 15.4% of the variation in SCA / 90 was explained by variation in PEA / 90 (R² = 0.154, p = 0.0011). This indicates a relatively weak relationship between possession ending actions and creative output within this positional group. This is perhaps unsurprising given the variety of roles occupied by modern fullbacks, with some operating as attacking wing-backs while others frequently move inside to form part of a back three.
Figure 1: PEA / 90 vs SCA / 90 for fullbacks in the Premier League during the 2025/26 season. The size of each point represents the player's direct goal involvement over the season.
Looking at Figure 1 we can see that Pedro Porro was by far the most dominant fullback in the league last season with 13.99 PEA / 90 mins and also the most SCA / 90 with 2.83. This is not a surprising result since a lot of Tottenham’s tactics under Thomas Frank relied on working the ball to Porro and using his crossing ability to create chances. The second most ball dominant fullback was Patrick Dorgu (12.14 PEA / 90 mins), which again is not a surprising result since he spent periods of last season under Carrick playing as a left winger which will naturally increase his number of possession ending actions.
Rather than simply identifying the player with the highest PEA / 90 as the most creative, the residuals allow us to identify players whose SCA / 90 was unusually high or low relative to their level of ball involvement. On this basis, Jeremie Frimpong was actually the most effective creator, producing 1.05 more SCA / 90 than predicted by the regression model. He was followed by Brighton's Maxim De Cuyper (+1.00) and teammate Andy Robertson (+0.98).
At the other end of the spectrum, Conor Bradley, Jake O'Brien and Rico Henry recorded the three most negative residuals, at −0.96, −0.87 and −0.86 SCA / 90 respectively. However, these results need to be interpreted in the context of each player's role. O'Brien and Henry frequently tuck inside during possession to form a back three, providing defensive stability against counterattacks. Both have also played extensively as centre-backs, so their relatively low creative output is consistent with their tactical responsibilities.
Conor Bradley presents a more interesting outlier. Unlike O'Brien and Henry, Bradley is an attacking fullback in a Liverpool side that frequently uses its fullbacks as important wide outlets. His large negative residual is therefore less easily explained by his positional role, making him potentially the most wasteful fullback in the league last season.
Midfielders
The next positional group was the midfielders who demonstrated the strongest relationship between PEA / 90 and SCA / 90 of any positional group with an R² of 0.407 and a p-value of 3.32 × 10⁻¹³ across 104 players in the dataset. This is possibly due to the distinct roles within the midfielder group, where there are defensive minded players who are less involved in possession and tasked more prominently with winning the ball back and preventing counter attacks compared to the out and out attacking midfielders who are often the main creative source within their team.
Figure 2: PEA / 90 vs SCA / 90 for Midfielders in the Premier League during the 2025/26 season. The size of each point represents the player's direct goal involvement over the season.
Beginning at the lower end of possession ending actions on Figure 2, we see Ilia Gruev with the lowest count at 4.99 per 90, even less than the least involved fullback, Piero Hincapié at 5.42 PEA / 90. While this may seem unusual, Gruev's low PEA / 90 may reflect his role as a deeper midfielder within Leed's attacking system, where his responsibilities are more focused on retaining and circulating possession than repeatedly ending possessions through shots and risky passes.
While at the other end, Ryan Christie ranks as the most ball dominant midfielder and in fact player in the whole league with 16.34 PEA / 90 but he does not have the creative output to match, with just 2.28 SCA/ 90. This represents a production of 1.38 less SCA / 90 than expected by the regression line, but this is not the worst underperformancein the league. West Ham’s Lucas Paquetá produces 1.55 less SCA / 90 than expected and as a highly creative midfielder with a large responsibility in West Ham’s attack demonstrates a wasteful use of his opportunites. This could support West Ham’s decision to sell him mid-season, despite being in the midst of a relegation battle, since he wasn’t providing good enough attacking quality for how much they depended on him.
Bruno Fernandes registered the highest SCA / 90 at 5.90, while also recording a positive residual of 2.72. Combined with his 30 goals and assists, this provides some statistical support for my friend's original claim about Bruno's attacking influence. However, the next step is to understand how this output fits within his specific role at Manchester United.
Rayan Cherki was the next highest creator with 4.67 SCA / 90 in a season where he was widely regarded as one of the league’s most exciting attacking players. Phil Foden managed similar output with 4.02 SCA / 90 in what was called one of his worst seasons ever, despite far less possession ending actions. Considering these two players were in direct competition for minutes, its interesting to see the narrative around Cherki being labelled as one of the best in the league while Foden was actually the more efficient creator with a residual SCA / 90 of 1.75 compared to Cherki’s 1.12.
Another interesting player to note is Nottingham Forest’s Morgan Gibbs-White, who after Bruno Fernandes, had the best goal output with 19 combined goals and assists of any midfielder. However, looking at his position on Figure 2 he does not standout as a particularly effective creator with a residual SCA / 90 of just 0.28. This demonstrates again that context within the team matters, since Gibbs-White still produces elite attacking output without needing to dominate possession to the same extent as some of the league's other high-performing midfielders.
Wingers
The wingers were the group of most interest to me, as players who’s primary role is to be major creative threats for their teams, exactly what my metrics attempt to quantify. The 48 wingers demonstrated an R² of just 0.174 (p = 0.003), meaning that only 17.4% of the variation in SCA / 90 was explained by PEA / 90. This is considerably weaker than the relationship observed among midfielders, suggesting that possession involvement alone is a relatively poor predictor of creative output among wingers.
Figure 3: PEA / 90 vs SCA / 90 for Wingers in the Premier League during the 2025/26 season. The size of each point represents the player's direct goal involvement over the season.
The immediate standout from Figure 3 is Jeremy Doku, who recorded the highest positive residual among the wingers at +2.34 SCA / 90. In contrast, his Manchester City teammate Antoine Semenyo recorded the largest negative residual, producing 1.96 fewer SCA / 90 than predicted by the regression. However, this should not necessarily be interpreted as poor creative performance. Semenyo recorded 21 goals and assists, the highest attacking output among the wingers in the dataset, suggesting that his role was different rather than simply less effective. The complementary roles of the two players provide an interesting explanation. When Doku and Semenyo operated on opposite wings, Semenyo's 11.45 PEA / 90 compared with Doku's 14.33 PEA / 90 suggests that Doku was more heavily involved in ending possessions and creating opportunities, while Semenyo was more focused on finishing chances. In this context, Semenyo's negative residual may reflect the distribution of attacking responsibilities within Manchester City's system and actually be beneficial to the likes of Doku.
Behind Semenyo, Kevin Schade and Brennan Johnson had the next lowest residuals with -1.08 and -1.06 respectively, but again, I don’t think we can immediately label them as wasteful. During his time at Tottenham, Johnson was named “back-post Brennan” by fans due to his tendency to meet crosses at the back post for simple tap-in goals. Schade appears to occupy a similar role at Brentford, with his attacking contribution often focused on finishing rather than creating for teammates. While Johnson didn’t have the direct goal involvement last season to balance his lack of creativity, I don’t think he or Schade should be considered significantly wasteful given their roles within their teams.
Strikers
The final positional group was the strikers, who demonstrated an R² of 0.208 (p = 0.005) across the 37 players in the dataset. The relatively weak relationship between PEA / 90 and SCA / 90 suggests that, like wingers, strikers fulfil a wide range of attacking roles. While some primarily occupy the box and focus on finishing chances created by their teammates, others are heavily involved in build-up play and act as creative focal points for their teams.
Figure 4: PEA / 90 vs SCA / 90 for Strikers in the Premier League during the 2025/26 season. The size of each point represents the player's direct goal involvement over the season.
Looking at figure 4 I think two interesting groups of players emerge. The first of which contains three of the top four goal contributing strikers in the league last season, Haaland (35), Thiago (23) and Watkins (19). This group, also containing the likes of Gyökeres and Wilson, demonstrates players whose attacking contribution is weighted heavily towards finishing rather than chance creation. Despite recording some of the highest goal involvements in the league, they generally have relatively low SCA / 90 and little positive residual, suggesting that much of their attacking value comes from finishing opportunities rather than being involved in the build-up to them.
The other interesting group that emerges is what I would define as the hybrid-forwards, contaning the likes of João Pedro, Ekitiké, Junior Kroupi and Okafor. While, these players are not as prolific as the previously mentioned set of palyers (20, 15, 13 and 9 G+A respectively), they are much more heavily involved in possession, with around 11 PEA / 90, and are more frequent chance creators with around 2 SCA / 90. This does not necessarily make them better players, but demonstrates that attacking responsibility varies between teams and tactical systems.
One specific player worth noting is Mathys Tel who ranked as the most ball dominant striker with 12.86 PEA / 90 and a residual SCA / 90 of 1.30, making him a standout creator. This is a somewhat surprising result but can be largely be explained by the fact that Tel spent much of last season operating as a winger, due to Spurs’ injury crisis. His high PEA / 90 is therefore likely influenced by the greater involvement expected from a wide attacking player. Compared with the winger group, this would make Tel less of an outlier.
Evaluation
After analysing each positional group, I think it is fair to say that comparing PEA / 90 to SCA / 90 across the league provides a useful overview of how a player's creative output compares to their level of involvement. For some positions, such as midfielders, this relationship is relatively clear, while for others, such as fullbacks, there is much greater variation due to the different responsibilities and tactical roles they can occupy.
This is the main limitation of this analysis. The residuals can identify players whose creative output is higher or lower than expected given their level of involvement, but they cannot explain why this is the case. Tactical context is therefore essential before judging whether a player is genuinely over or underperforming relative to their role. This demonstrates that league-wide positional comparisons are useful for identifying interesting players and trends, but a more detailed team-level analysis is required to understand the true attacking value players bring to their teams.
Team Analysis
While the first part of this analysis investigated the relationship between possession ending actions and shot creating actions to evaluate creative involvement across different positional groups, it became clear that the usefulness of these comparisons was limited without an understanding of a player's role within their team. Therefore, the second part of the analysis aimed to provide greater tactical context by comparing usage rates against attacking involvement within each team in the league.
The team analysis also investigated whether usage rates could be used to identify changes in a team's tactical structure following transfers, and whether the metric could provide insight into the characteristics that may contribute to a team's attacking success. Finally, I explored the potential applications of usage rates for identifying high scoring players in Fantasy Premier League.
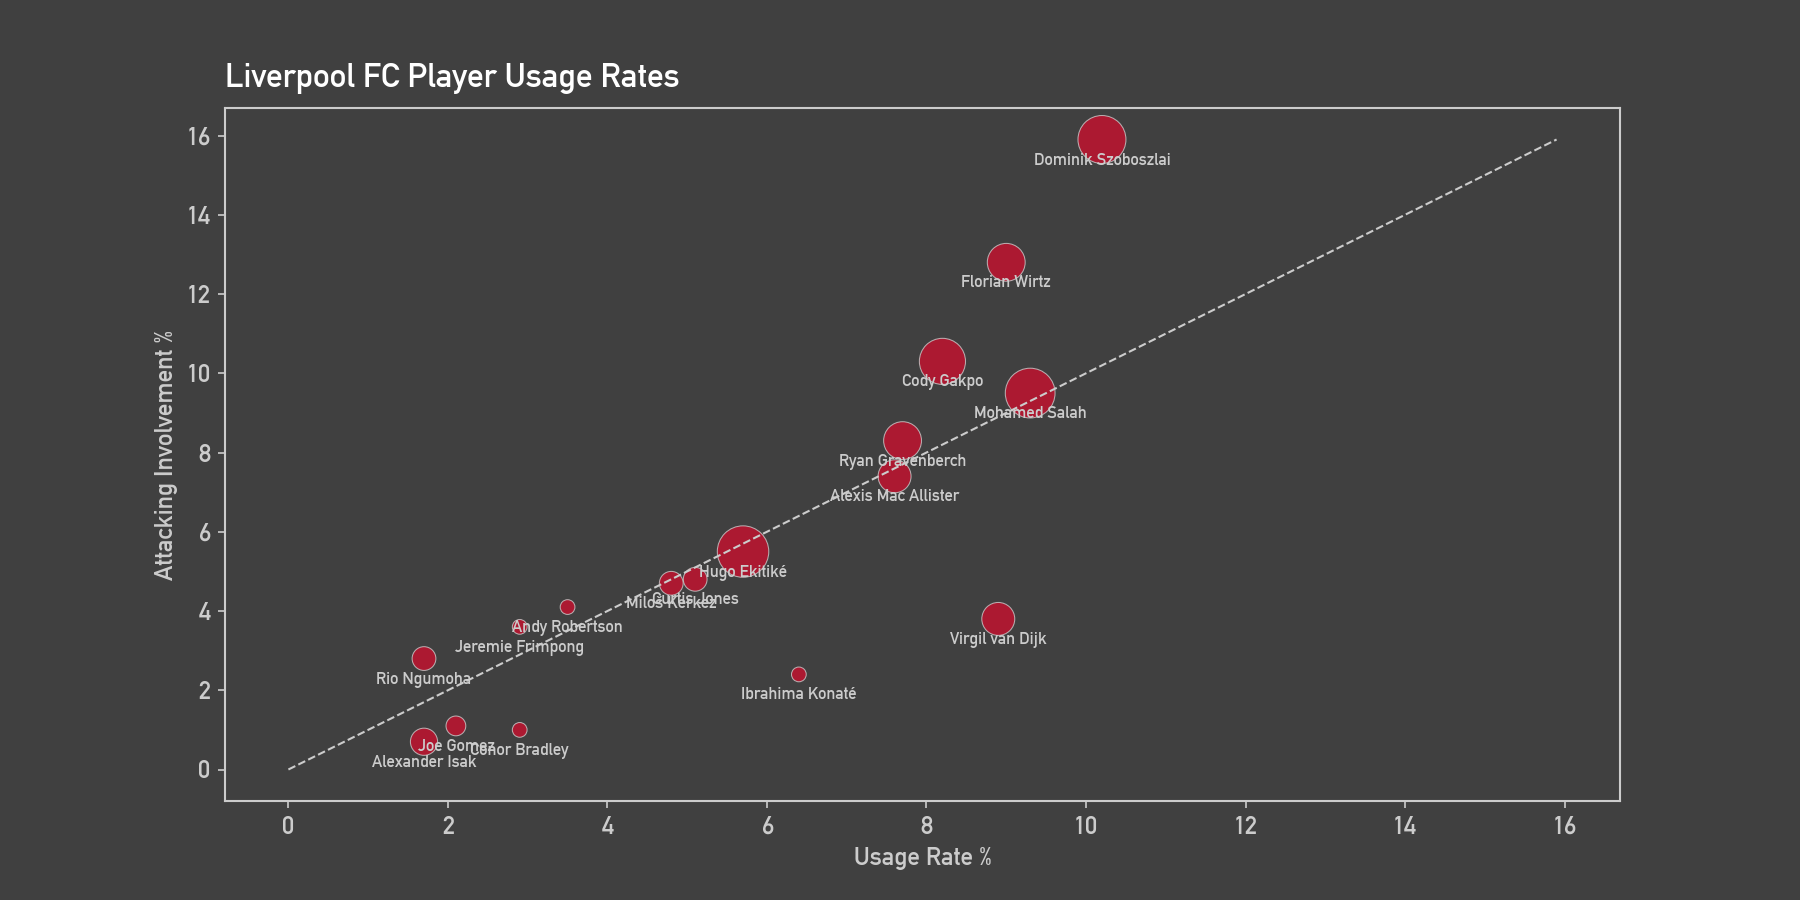
Figure 5: Liverpool's usage rates against attacking involvement for the 2025/26 season. The plotted line shows Relative Creative Efficiency (RCE) with a value of 1 representing a player whose creative output is in line with their usage rate.
Figure 5 shows an example of Usage Rate against Attacking Involvement for Liverpool. The diagonal line represents Usage Rate = Attacking Involvement, which forms the basis of the Relative Creative Efficiency (RCE) metric. Players above this line have an RCE greater than 1, meaning their share of the team's Shot Creating Actions is greater than their share of Possession Ending Actions. Conversely, players below the line have an RCE below 1, meaning their share of Possession Ending Actions is greater than their share of Shot Creating Actions.
However, RCE should not be interpreted as a measure of overall player quality or creativity in isolation. The figure is naturally biased towards attacking players because the y-axis measures a player's proportion of team SCA. It is therefore common to see defensively minded players below the RCE line, as they may be heavily involved in build-up play and possession without being responsible for a large proportion of their team's chance creation. A low RCE in this context does not necessarily indicate poor or inefficient play, but may instead reflect the player's tactical role.
There is also an important limitation relating to playing time. Usage Rate and Attacking Involvement are calculated as a player's proportion of their team's total actions rather than being normalised for minutes played. As a result, the figures describe how much of a team's overall attacking activity a player was responsible for, rather than how involved they were on a per-minute basis. Players who feature regularly across a season have more opportunities to accumulate a large share of their team's actions, while players with limited minutes may have relatively small overall shares even when their involvement is high when they play. Therefore, a high Usage Rate should not automatically be interpreted as evidence that a player is more ball dominant on a per-90 basis.
Player Roles
As discussed in the previous sections, a player's total PEA can be divided by their team's total PEA to calculate their Usage Rate. The same approach can be applied to SCA to calculate a player's Attacking Involvement. Plotting these two metrics against each other provides an overview of how much of a team's possession-ending activity a player is responsible for compared with their share of the team's creative output. This provides further context for the findings from the positional analysis and helps to identify the different roles players occupy within their teams.
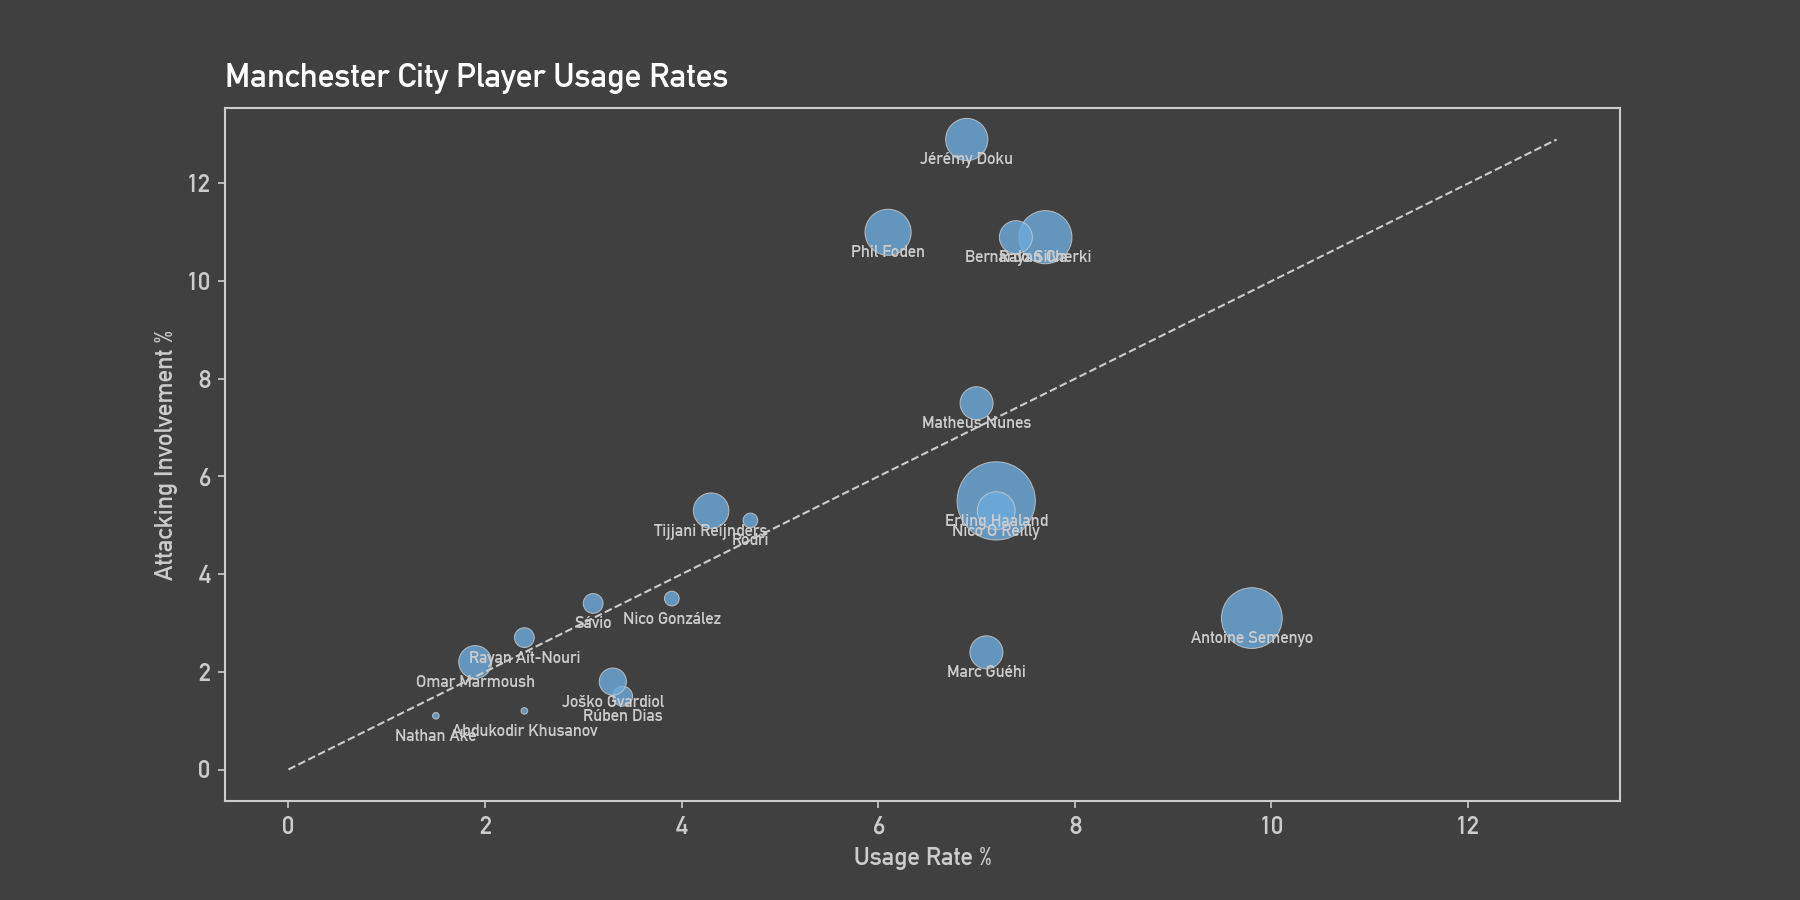
Figure 6: Manchester City's usage rates against attacking involvement for the 2025/26 season.
I previously discussed how Figure 2 suggested that Phil Foden generated more creative output than expected for his level of involvement compared with Rayan Cherki, despite the different narratives surrounding the two players during the 2025/26 season. The evidence from Figure 6 provides further context for this comparison.
Within Manchester City, Rayan Cherki had a higher Usage Rate than Foden, accounting for 7.7% of the team's PEA compared with Foden's 6.1%, despite playing fewer minutes (1,794 compared with 2,107). This suggests that Cherki was more heavily involved in possession-ending actions when on the pitch. However, both players had almost identical Attacking Involvement, accounting for 10.2% and 10.3% of City's SCA respectively. As a result, Foden had the higher Relative Creative Efficiency, with an RCE of 1.80 compared with Cherki's 1.42. This provides further evidence that Foden's creative output was strong relative to his involvement, although it does not necessarily demonstrate that he was a better player than Cherki. Instead, I believe it highlights Guardiola's attitude towards the two players, allowing Cherki greater creative freedom.
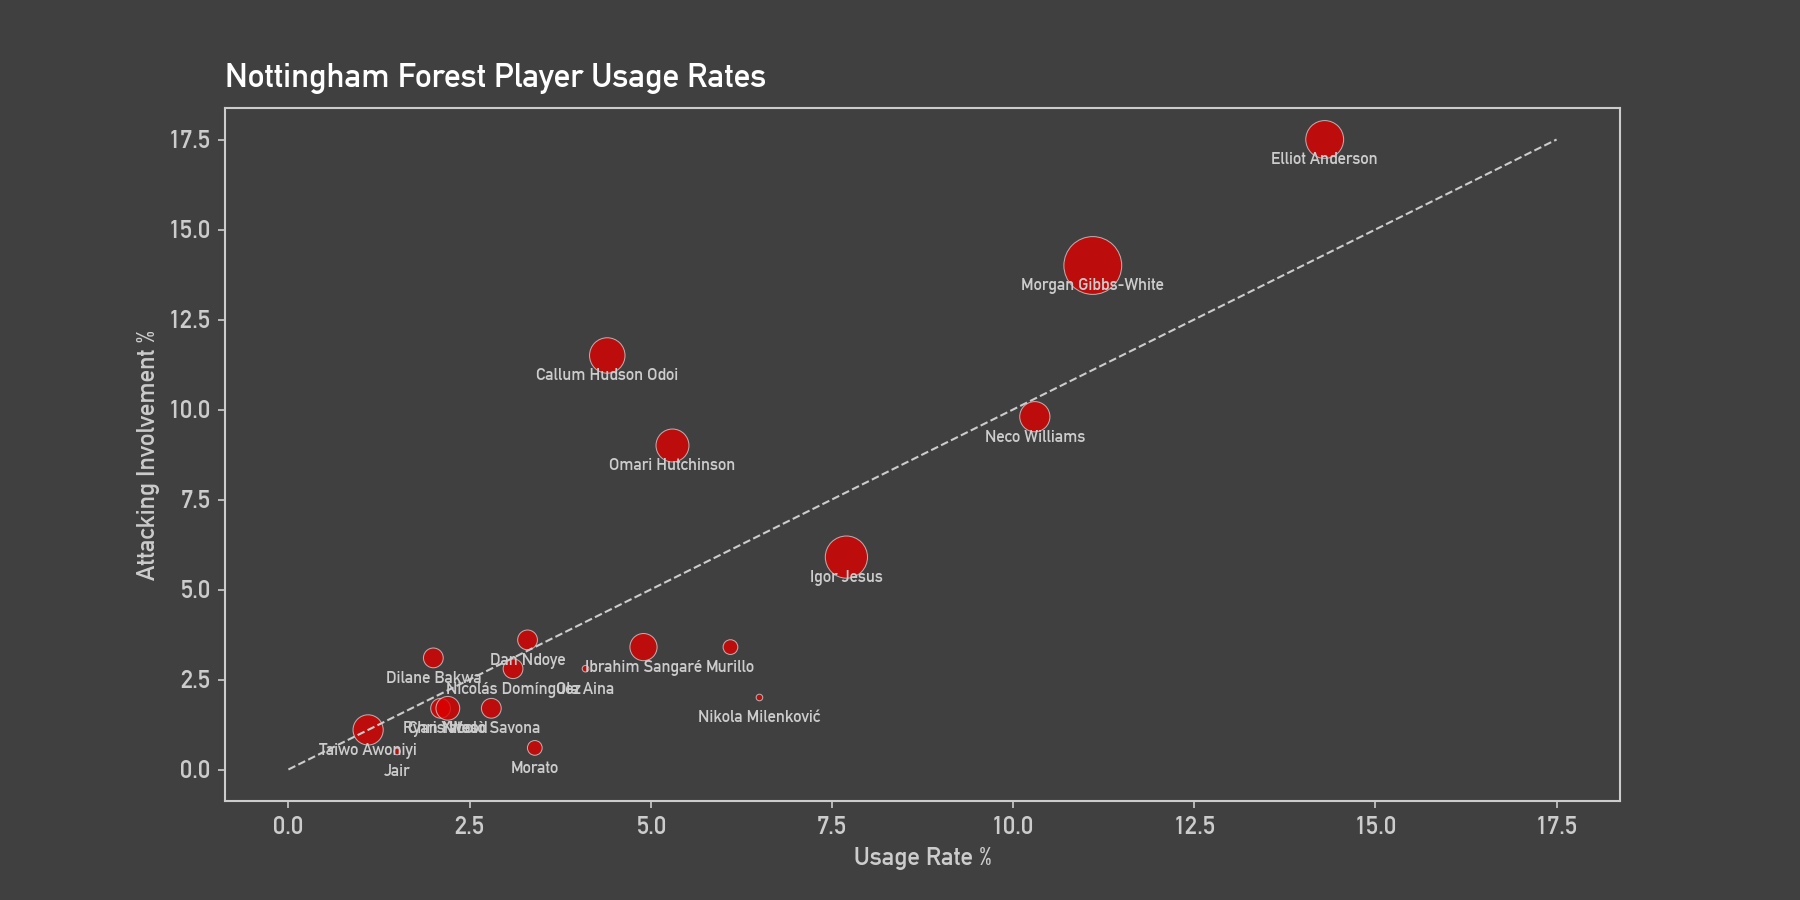
Figure 7: Nottingam Forest's usage rates against attacking involvement for the 2025/26 season.
Another interesting example is Morgan Gibbs-White, who appeared relatively unremarkable in Figure 2 despite recording the second-highest goal involvement among midfielders. However, looking at Nottingham Forest's Usage Rates provides much greater context for his importance to the team.
Gibbs-White accounted for 11.1% of Forest's PEA, second only to Elliot Anderson at 17.5%, while also recording an RCE of 1.40. This demonstrates that he was heavily involved in Forest's possession-ending actions while also contributing a greater share of their creative output than his usage would suggest. Combined with his high goal involvement, this indicates that Gibbs-White occupied a particularly important attacking role within Forest's system.
This once again demonstrates why the positional analysis cannot be interpreted independently of team structure. A player who appears relatively average when compared with other players in their position may be performing a highly important role within their own team.
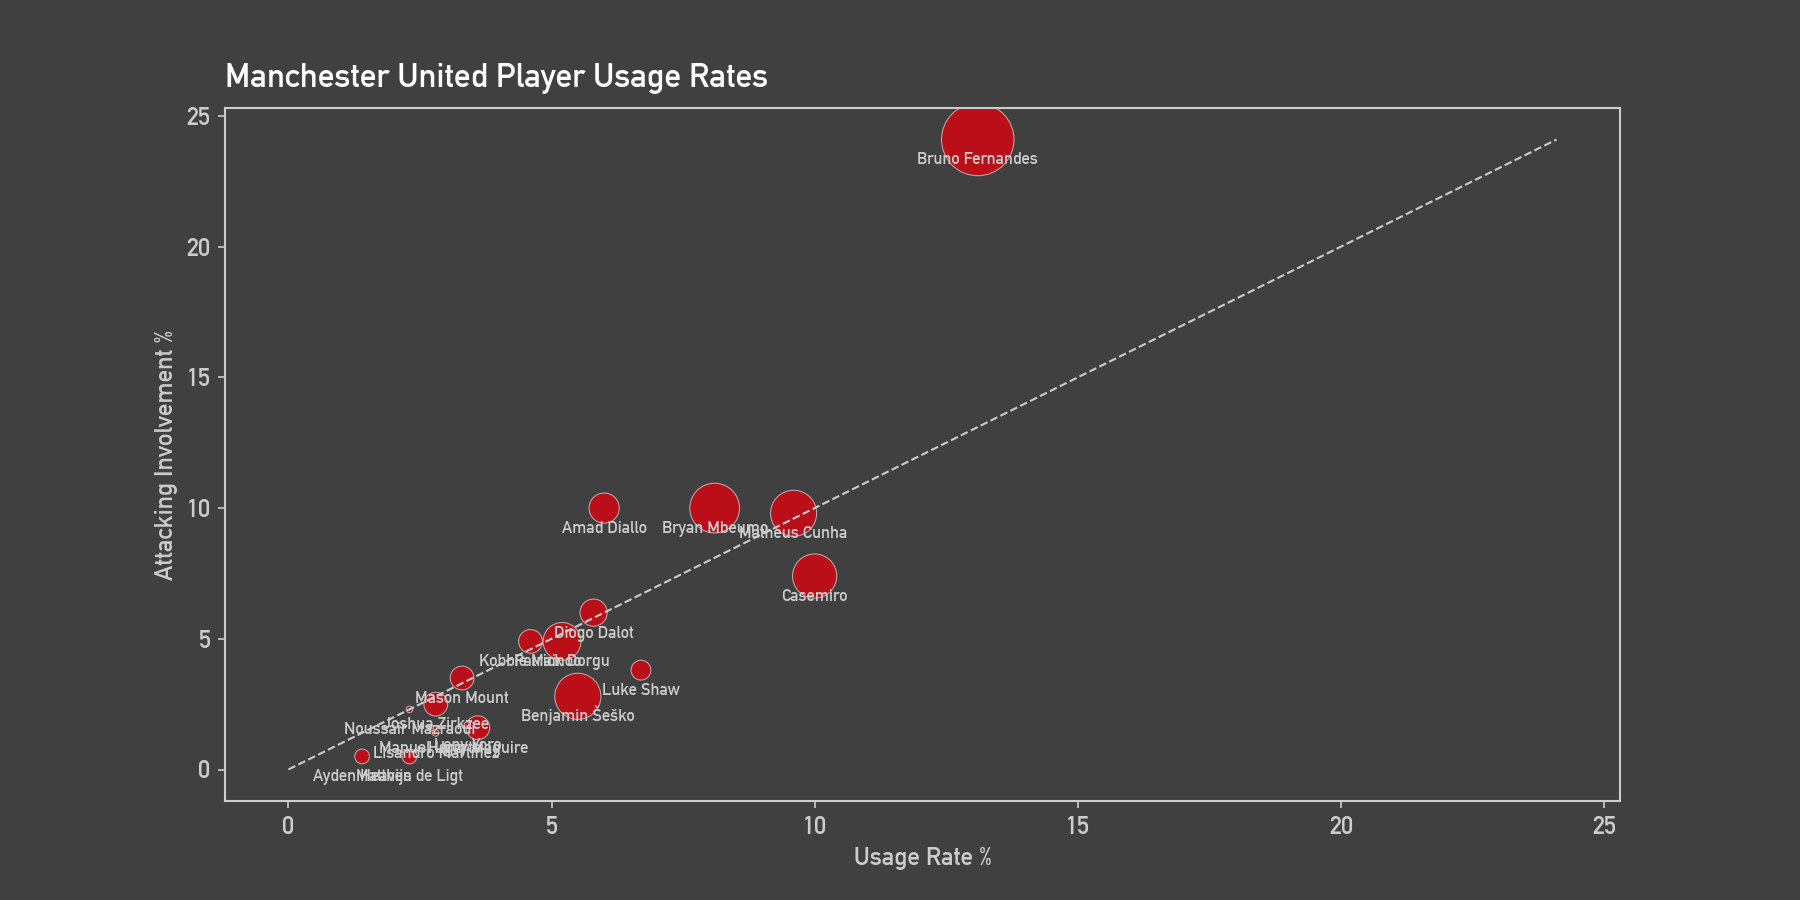
Figure 8: Manchester United's usage rates against attacking involvement for the 2025/26 season.
The final figure I have to mention is Manchester United, where I may finally have to concede the debate to my friend that Bruno Fernandes is elite. Not only did Fernandes stand out as one of the most positive creative outliers among midfielders in Figure 2, but Figure 8 also demonstrates his extremely central role within Manchester United's system. He had by far the highest Usage Rate on the team at 24.1%, meaning almost a quarter of Manchester United's PEA was attributed to him. He also had the highest Attacking Involvement at 13.1% and recorded 30 direct goal involvements. So Despite having an exceptionally large share of the team's possession-ending actions, he still generated a greater share of their SCA than would be expected from his level of usage. Rather than simply being a high-volume player, Fernandes was able to combine an extremely dominant role with strong creative output, providing further evidence for his elite attacking contribution.
Transfer Analysis
Another application I considered for these metrics was investigating player transfers. By collecting the same data from other major European leagues, I was able to plot summer 2026 signings against their new team's data from the previous season. This provides an indication of the roles these players might be expected to occupy and can offer insight into why teams may have targeted particular players. It can also be used to identify potential gaps within a team's squad and assess whether their recruitment appears to address those weaknesses ahead of the new season.
Once again, there are some important limitations to this approach. Plotting a transferred player's data directly onto their new team's data provides a useful indication of what we might expect from them, but it cannot predict the role they will actually occupy. A player's output can change significantly when moving to a different team and league, particularly when they are surrounded by different teammates and asked to play within a different tactical system. Their previous Usage Rate, RCE and Attacking Involvement therefore should not be treated as fixed characteristics that will simply transfer to their new team. Instead, this analysis should be viewed as a projection of how a player might fit into their new team's existing structure.
Furthermore, I was only able to collect comparable data from La Liga, Serie A and the Bundesliga. Therefore, only transfers from these leagues are included in this analysis. This means that some squads may appear incomplete when viewed through these figures, despite having made other significant signings from leagues outside the available dataset.
Figure 9: Tottenham Hotspur's Usage Rates projected with summer 2026 transfer signings. * Only singings with available datafrom the Premier League, La Liga, Serie A and the Bundesliga are shown.
The first team I want to analyse is Tottenham, who narrowly avoided relegation last season by finishing 17th. Their Usage Rate profile from last season suggests a heavy reliance on Pedro Porro (12.1%), with no similarly dominant creative core elsewhere in the squad.
Their summer recruitment appears to address this lack of ball involvement. Four of their incoming players, Mateus Fernandes, Sandro Tonali, Jan Paul van Hecke and Macros Senesi, had higher Usage Rates than every Tottenham player other than Porro last season. The two centre-backs, van Hecke and Senesi, also appear to offer a greater degree of involvement in possession than Tottenham's existing defensive options, potentially fitting De Zerbi's system which places greater emphasis on building from the back.
Mateus Fernandes is particularly interesting. His Usage Rate at West Ham suggests that he was given a highly influential role within their possession structure, while his RCE of 1.68 indicates that his creative output was also high relative to that involvement. If this level of involvement can be replicated at Tottenham, he could potentially help compensate for the absence of Xavi Simons and provide another major source of attacking involvement alongside Porro.
However, Tottenham's difficulties in front of goal during the opening five games of the new season highlight another potential weakness in their squad. With Richarlison, who led the team with 11 league goals last season, no longer part of the squad, Figure 9 suggests that Tottenham may lack an established alternative source of goals.
Dominic Solanke and new signing Omar Marmoush occupy a similar area of the figure, both accounting for roughly 2% of their team's Usage Rate and Attacking Involvement in the previous season. They also both scored three league goals in the respective datasets. On the surface, this suggests that neither player was heavily involved in either ending possessions or creating chances for their team.
However, this is another example where the raw figures require context. Solanke only played 1,000 minutes last season due to injury struggles, while Marmoush played 734 minutes as a second-choice option behind Haaland. Their relatively low Usage Rates therefore do not necessarily indicate a lack of attacking ability. Instead, Tottenham will hope that greater playing time and a more prominent role can increase their involvement. If this does not happen, the figures suggest that their attacking output could remain a potential weakness and lead to another season of struggle in front of goal.
Figure 10: Leeds United's Usage Rates projected with summer 2026 transfer signings. * Only singings with available datafrom the Premier League, La Liga, Serie A and the Bundesliga are shown.
Another interesting team to examine is Leeds United, who have made a strong start to the 2026/27 season, remaining unbeaten after their opening five games. Their Usage Rate profile suggests that this start may be supported by a recruitment strategy which has strengthened last season's squad.
After finishing 14th last season, Leeds retained many of their key players while strengthening in several areas. One of their most significant departures was Pascal Struijk, who had the highest Usage Rate among Leeds' starting back three at 7.1%. His replacement, Sassuolo's Tarik Muharemović, may be capable of providing a similar level of involvement in possession, as a dominant ball-playing centre-back with a Usage Rate of 8.2%.
Further forward, Dominic Calvert-Lewin was Leeds' primary goal threat last season, while Brenden Aaronson and Anton Stach were among their most important creative contributors, with Attacking Involvement rates of 9.9% and 14.4% respectively. The signing of Harry Wilson from Fulham therefore appears particularly significant. Wilson contributed 17 goals and assists last season while maintaining an Attacking Involvement of 10.1%, suggesting that he could provide both an additional source of goals and another creative outlet, reducing Leeds' reliance on Calvert-Lewin.
Leeds also appear to have strength their attacking depth after the loss of Wilfried Gnonto. The attacker played a minor role last season, managing just 535 minutes, so was allowed to join Fiorentina. As a replacement, Leeds managed to sign the exciting young winger, Jean-Mattéo Bahoya. The 21-year-old played 1,335 minutes for Eintracht Frankfurst last season, recording three goals, four assits and an RCE of 1.50. While Bahoya may not immediately become a major contributor, his previous involvement and creative efficiency suggest that he was a smart signing and could improve Leeds' attacking depth.
Overall, Leeds' recruitment appears to have addressed several of the areas highlighted by their Usage Rate profile from last season. Their strong start therefore provides an interesting early indication that the squad construction may be translating effectively onto the pitch. However, as with the rest of this analysis, these conclusions should be treated as projections rather than predictions. A player's Usage Rate, RCE and goal involvement are not fixed characteristics, and their output may change considerably as they adapt to a new team, tactical system and the demands of the Premier League.
Fantasy Premier League
One final application of usage rates that I noticed while analysing some of the data is its potential application to Fantasy Premier League. As an avid player, I am always looking for methods to pip my friends to the top of our league and I think usage rates can be a beneficial tool in achieving that.
Across the 20 Premier League teams, there was a notable degree of overlap between the players with the highest Usage Rates and those who scored the most FPL points. Of the 60 positions across each team's three highest Usage Rate players, 37 were occupied by players who also appeared within their team's top three FPL-scoring outfield players. This represents an overall overlap of 61.7%.
The consistency of this relationship is perhaps more interesting than the overall figure. Every team had at least one player who appeared in both their top three Usage Rate players and their top three FPL scorers, while 13 of the 20 teams (65%) had at least two players appearing in both groups. Three teams had all three of their highest Usage Rate players within their top three FPL scorers.
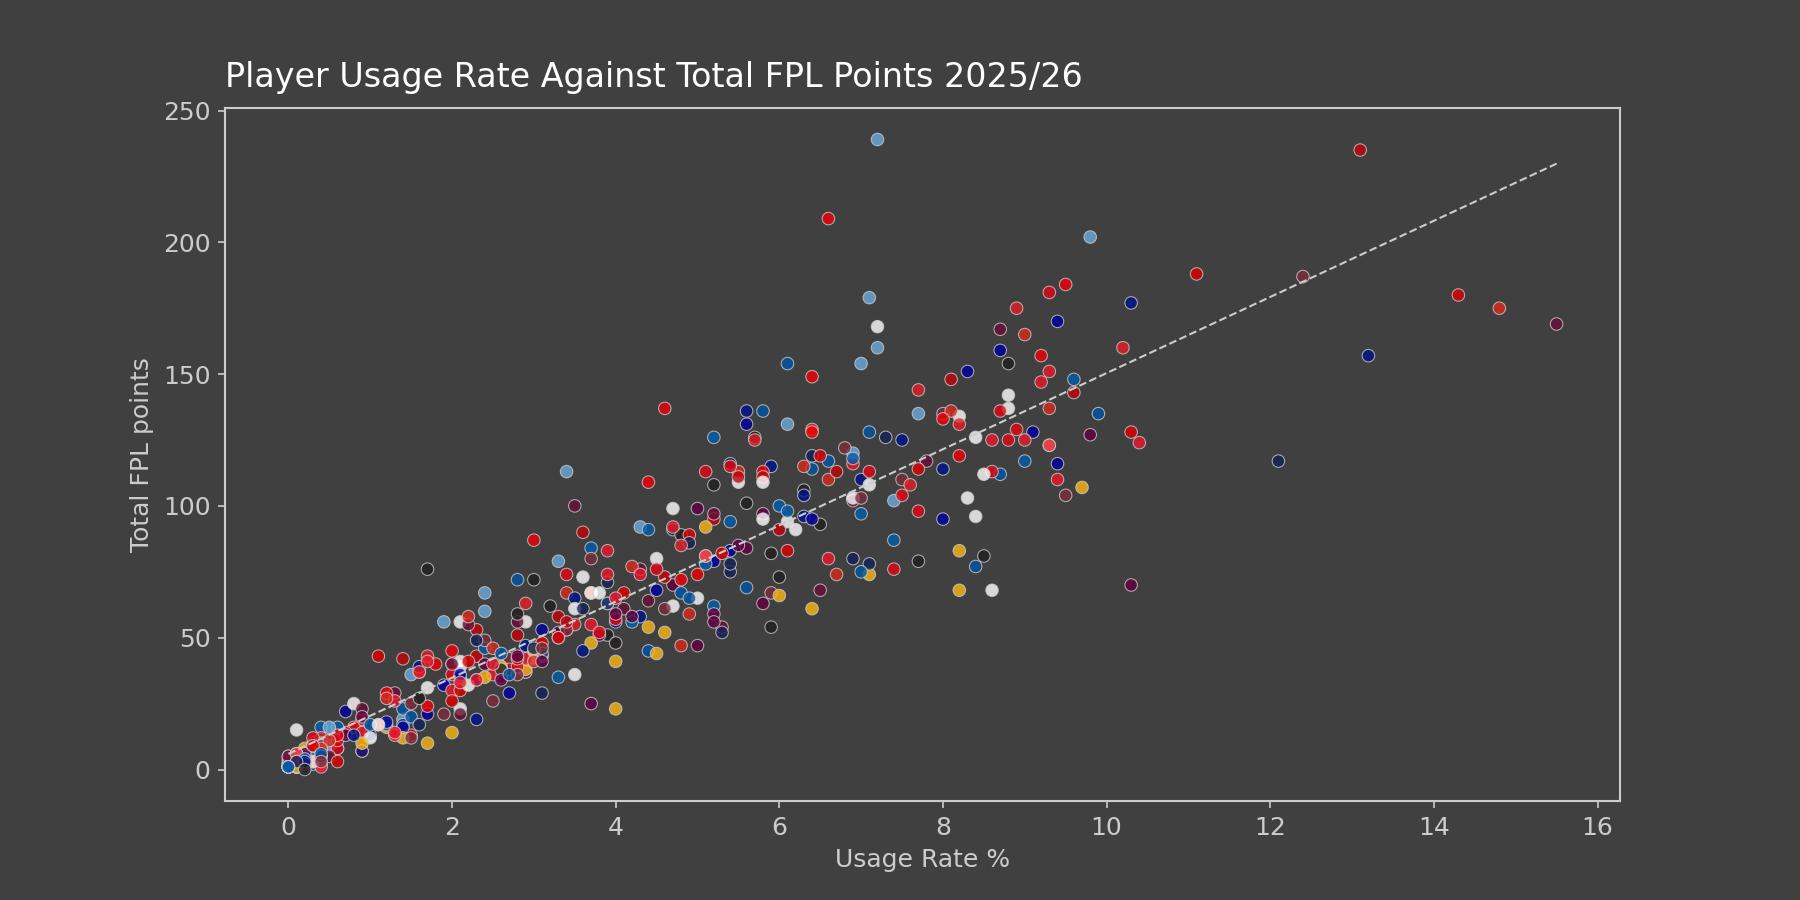
Figure 11: Usage Rate plotted against total FPL point for all elegible Premier League players in the 2025/26 season.
Upon plotting Usage Rate against total FPL points, as seen in Figure 11, a clear relationship emerges, supporting my initial hypothesis that more ball-dominant players tend to accumulate more FPL points. A statistically significant relationship was identified between Usage Rate and total FPL points, with variation in Usage Rate explaining 82.7% of the variation in total FPL points (R² = 0.827, p = 6.705 × 10⁻¹⁸⁵). Since a large proportion of FPL points are awarded for on-ball attacking actions such as goals and assists, this relationship is intuitive: players who are more heavily involved in their team's attacking play have greater opportunities to contribute to the events that generate FPL points.
Furthermore, the players with the highest Usage Rates are often among their team's most important attacking players. This suggests that Usage Rate could have a potential application in Fantasy Premier League, particularly when identifying highly involved players who may be overlooked by FPL managers. For example, combining Usage Rate with player ownership data could help identify high-usage players with relatively low ownership who may represent potential differentials.
One important limitation is that Usage Rate can sometimes be influenced by playing time rather than purely by ball dominance. Since the metric measures a player's PEA as a proportion of their team's total PEA, players who spend more time on the pitch have more opportunities to accumulate possession-ending actions and therefore a larger share of their team's total. This could also contribute to the relationship with FPL points, as players who play more minutes naturally have more opportunities to score points regardless of how frequently they use the ball.
Limitations
The first limitation of the analysis was the availability and quality of the underlying data. I was unable to find freely available data for miscontrols or official SCA totals across the entire season. As a result, miscontrols were omitted from the Possession Ending Actions calculation, while SCA was manually derived from the season event data. PEA and SCA should therefore be treated as estimates rather than definitive measures, and the results of the subsequent analysis should be interpreted with this limitation in mind.
A second limitation was the influence of playing time on the Usage Rate calculation. Since Usage Rate was calculated from a player's total PEA as a proportion of their team's total PEA across the season, players who spent more time on the pitch had more opportunities to accumulate possession-ending actions. This means that a high Usage Rate does not necessarily indicate that a player is more ball dominant on a per-minute basis. This limitation was particularly relevant to the FPL analysis, where total playing time can also directly influence the number of points a player has the opportunity to accumulate.
The most significant limitation, however, was that Usage Rate and Relative Creative Efficiency cannot be interpreted effectively without considering tactical context. Throughout the player analysis, several players appeared to be unusually efficient or inefficient based on their position relative to the regression line. However, examining their roles within their teams often provided an explanation for these results.
Therefore, the metrics developed in this project should not be considered standalone measures of player quality. Instead, they are most useful as tools for identifying interesting players, roles and tactical patterns which can then be investigated in greater detail.
Future Improvements
While I am happy that this project was able to establish a framework for adapting the concept of Usage Rate from basketball to football and applying it to player roles, team systems, transfers and Fantasy Premier League, there are several ways in which the methodology could be developed further.
The first improvement would be to strengthen the underlying data. I would like to find reliable data for miscontrols in order to make the Possession Ending Actions metric more complete, as well as official SCA data to replace the SCA values manually derived from season event data. Improving the quality and completeness of the underlying data would make the resulting metrics more robust and reduce the uncertainty surrounding the analysis.
A second improvement would be expanding the transfer analysis to include a wider range of leagues. I used data from La Liga, the Bundesliga and Serie A to estimate the Usage Rates of players joining the Premier League from those competitions. However, many Premier League transfers originated from leagues outside these three competitions, meaning the analysis could only provide a partial picture of how teams' squads had changed ahead of the new season. Expanding the dataset to include more leagues would allow a greater proportion of incoming players to be incorporated into the analysis.
The most significant improvement I would make would be to redesign the Usage Rate calculation itself. The current methodology calculates a player's total PEA as a proportion of their team's total PEA across the season, meaning that the metric is partly influenced by playing time. A player who plays twice as many minutes has more opportunities to accumulate PEA and therefore increase their share of their team's total.
A more sophisticated approach would account for the time a player spends on the pitch and calculate their PEA relative to the other players on the pitch during those periods. This would provide a closer football equivalent to basketball's Usage Rate, where a player's opportunities are evaluated relative to their teammates while they are actually on the court. Developing this version of the metric would allow Usage Rate to distinguish more effectively between players who are genuinely highly involved when they play and players who simply accumulate a large share of their team's actions through playing more minutes.
Conclusion
The aim of this project was to adapt the concept of Usage Rate from basketball and apply it to football to investigate whether it could provide a useful way of analysing player roles. While the Usage Rate developed in this project is a simplified version of its basketball equivalent, the analysis demonstrated that it can provide useful insight into how attacking involvement is distributed across players and teams.
I believe its strongest applications are in understanding player roles within a team, identifying potential gaps within a squad and assessing how potential signings might fit into a new team. By comparing a player's Usage Rate with their creative involvement, it is possible to distinguish between different types of attacking players and understand how they contribute within their team's tactical structure. This could potentially provide a useful scouting tool, allowing clubs to assess how prosepctive signings' ball dominance and creative efficiency would integrate into their exisiting squad.
Ultimately, the project demonstrated that Usage Rate is not a standalone measure of player quality. Its interpretation depends heavily on tactical context, playing time and the role a player performs within their team. However, when combined with other metrics and contextual information, I believe it provides a useful framework for analysing player involvement and identifying interesting tactical and recruitment trends. Further refinement of the methodology and underlying data could make Usage Rate an increasingly valuable tool within football analytics.
Technical Stack
| Area | Tools |
|---|---|
| Programming Language | Python |
| Data scraping | ScraperFC, SoccerData |
| Data processing | Pandas, NumPy |
| Analysis | SciPy, scikit-learn |
| Visualisation | Matplotlib |
| Interactive visualisation | Plotly |
| Development | Jupyter, VS Code |
| Version control | Github |